Time installing the indicator: Just a few minutes with our MetaTrader Pro setup
What does it do?
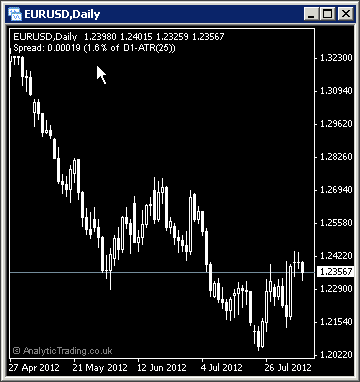
The Analytic Trading Spread indicator for MetaTrader adds a small line of text to the top left corner of your charts to show the current spread of the instrument, in price, pips or points – and these trading costs are then shown as a percentage of the current timeframe 1-bar Average Trading Range (ATR) from the last 25 bars.
What is it for?
The spread is the difference between the current bid (buy) and ask (sell) price of an instrument. Knowing this we can see the relative cost of trading this instrument, both compared to other instruments and as a percentage of the average trading range of each bar.
To understand the different trading costs, try comparing correlated instruments with different trading volumes like AUDUSD and NZDUSD, or Gold and Silver, or different instruments like EURUSD and the S&P500.
How do we use it?
The spread is your cost for entering and exiting a trade and should be taken into account when forming your trading strategy and deciding what timeframe and instruments to trade.
You will notice that the lower the timeframe – the higher the spread cost as a percentage of the average price movement over 1 bar/candle. The spread costs erode our trading edge, so to counter this effect we need to trade strategies that have an edge that more than accounts for the spread costs. The higher the trading costs, the greater the edge we need to still be able to profit from trading them.
The simplest way to minimise the proportion of the spread costs on your trading and investment is to work with strategies on the higher timeframes; Daily, Weekly and Monthly, and therefore longer-range targets.
You will also find that the more an instrument is traded, that is it’s liquidity, the lower the spread is for your trading costs. Then, less liquid asset classes like currency crosses, lesser-traded commodities, and shares tend to have a higher spread trading cost as a percentage, which you should factor into your targets and expectations.
We think you will find this small piece of important information on your charts will be very revealing and it will give you a more realistic expectation to use in your calculations when deciding on what and how often to trade.
Spread specific settings
In most cases these settings can be left on the default values, although users with different strategies or preferences to our own may want to be able to adjust them.
| Variable | Default Value | Possible Values | Description |
| ATRPer | 25 | whole numbers | The Average Trading Range (ATR) period that we calculate the percentage costs over. Generally a value of 25 will cover the average timespan of two timeframes higher and 5 would be a good average to cover one timeframe higher. |
| ATRTimeframe | 0 | 0, M1, M5, M15, M30, H1, H4, D1, MN | This is the timeframe used to calculate the ATR. 0 will show the current timeframe, and entering other timeframe values will use that timeframe specified. |
| ATRShift | 1 | whole numbers | To use full-bars in calculating this average we start from the previous bar/candle, the effect is relatively minor though. A value of 0 would calculate the average including the current bar’s range and 2+ would start 2 bars further back, and so on. |
| DisplayType | native | native/pips/points | This is the decimal point display of price. For example on EURUSD on a 5 decimal place broker; native=0.00100, pips=10, points=100. |


 Includes all Profiles, Templates and Indicators, with statistics, screen, email and smartphone alerts.
