 Get the MetaTrader Pro Setup
Designed for professional traders and private investors
We have applied our collective professional experience to create an organised and dynamic setup, designed to suit various trading and investment profiles on all markets available through MetaTrader brokers. Fast-track your learning curve with our Analytic Trading MetaTrader Pro Setup for your charting and market analysis.
Developed by experienced Data Analysts and Traders
We use MetaTrader as our software of choice to analyse price movements with our technical trading strategies.
As experienced traders, analysts and programmers, we have designed our custom MetaTrader Pro setup to show just the information we need to make high-probability trade decisions.
Our indicators work on all timeframes and any instrument that MetaTrader brokers offer – to suit your trading and investment profile. The Risk Manager expert advisor will help you manage your money, leverage and trades in a professional manner.
Due to the many ways these signals can be traded we have decided to publish our software and open our small trading community to fellow traders and investors, so you can have the support that a team of Data Analysts and Risk Managers provides, right on your desktop, working tirelessly all-day every-day.
Trading and investment with market intelligence
- Use simple price data charts to analyse the markets – avoid over-paying for inflated assets or selling rising ones short
- The standard lagging-indicators, installed by default with trading chart software, often distract new traders from the leading-edge price-action analysis that pro traders use to make regular profits and minimise losses.
- Save time calculating optimal profit-targets, safe stop-loss levels and your trade position-size
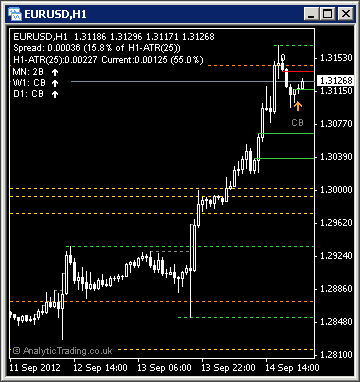
- Our market indicators are designed to show you all you need to know on a small screen area – so you can make intelligent trading decisions, and by displaying correlated instruments side-by-side you can see the highest-probability trade setups, within the overall market context.
- Easy to install and use without needing a high powered computer or lots of monitors
- Our software installer helps you add bespoke price-action indicators to all your demo and live MetaTrader installations – so you can have the same setup that took us years to design and optimise for our trading – and trade just as well from a small laptop or smartphone using the same window on the markets as we do.

Trading is a business and the profits are a measure of the quality of your decisions
You don’t need lots of computers and screens, giving you information overload all day, to be able to trade profitable. To trade with minimal stress, you are better off with less conflicting data, focused on the information relevant to your trades. We set and manage trades from a single screen setup or often a small laptop, just evaluating movements of the market price.
Once you learn to trade on the leading edge of charts, using price-action patterns, and removing lagging and averaging indicators, you will find trading is very logical.
Which timeframe to trade depends upon the time you have. Investors will want to analyse their positions each month or week. Position traders will want to re-analyse the markets once or twice a day. Day traders look at their charts every few hours, or even hourly, to find opportunities. And all traders will look more often when price is approaching a significant level they are monitoring to enter and exit trades and the best levels.
Our chart-setup is designed to make this analysis quick and logical for investors and traders to see the extremes of price movements on all timeframes. How you profit from this information is up to you…
Professional MetaTrader chart configuration
This website details the exact-same toolset that we use to trade for a living.
We like to trade time-efficiently so that we can still enjoy a variety of other interesting activities and business ventures – for a more balanced working life.
Our programming, data analysis and back-tested strategy development experience (using computer software to do the heavy lifting) can help you speed-up your learning curve and give you experience in the company of fellow professionals.
So, why share all this information? 70% of price movements are speculative trading and 30% are supply/demand based, we just trade less often at prices where both forces take the market to its extreme, so having a few more people trading in this way can help our trades move into profit, well within the available liquidity of the markets.
Plus, we are a sociable bunch – learning more from sharing, challenging and refining our analysis as a group than we ever could have alone.
We hope your feedback will help us to continue to improve our toolset and people’s understanding of financial markets.
Tried & tested professional trading techniques applied to liquid markets
You will often hear that professional traders do not have any other indicators on their charts than simple support and resistance lines.
We look at the actual price numbers and relative position of the current price to past movements.
The most recent price bar/candle patterns are much closer to the turning point of price movements (than the standard lagging indicators that show little more than averages of the the past).
So, we can enter our trades earlier in a new movement and get out earlier on reversal.
Often correlations between instruments and currency pairs can be used to get an overall view of market sentiment and bias. You will hear this called risk-on and risk-off.
We are trading the rise and fall of US Dollar value in relation to the things you can buy and sell with it, so on all our chart layouts you will see that we watch the S&P500 as our benchmark for dollar strength and weakness as overall investor confidence moves between bullish, bearish and neutral.
Optimised for all currencies, commodities, bonds, indexes and shares
We trade currency, commodity, index and bond markets because their liquidity gives much cleaner technical signals.
However, our technical trading patterns occur in all markets including shares, so with a little adjustment for slippage, gaps and spreads we can find good signals in all instruments that have price charts available on MetaTrader.
Technical trading signals occur in all free-market instruments and, because these markets are so vast in monetary flows, there are ample opportunities for traders to profit from the ebb and flow of markets with supply and demand changes.
So, we can apply these same technical analysis principles to help manage exposure to price movements in anything that can be traded; be it the currency of your holiday-home mortgage, shares and indexes linked to your pension or savings account, or exposure to commodity prices and interest rates for your company.
Once you see how we work, we are sure that you will look at market charts with a whole new perspective!
Start your FREE Analytic Trading education now
Read through years of experience in just a few hours
The right information and setup is essential to improve your understanding of technical trading and investment. Protect yourself from the many ways of losing money in this business – review our concise collection of experience and top-tips to become a smarter trader and investor.


