Time installing the Profiles: Just a few minutes with our MetaTrader Pro setup
What does it do?
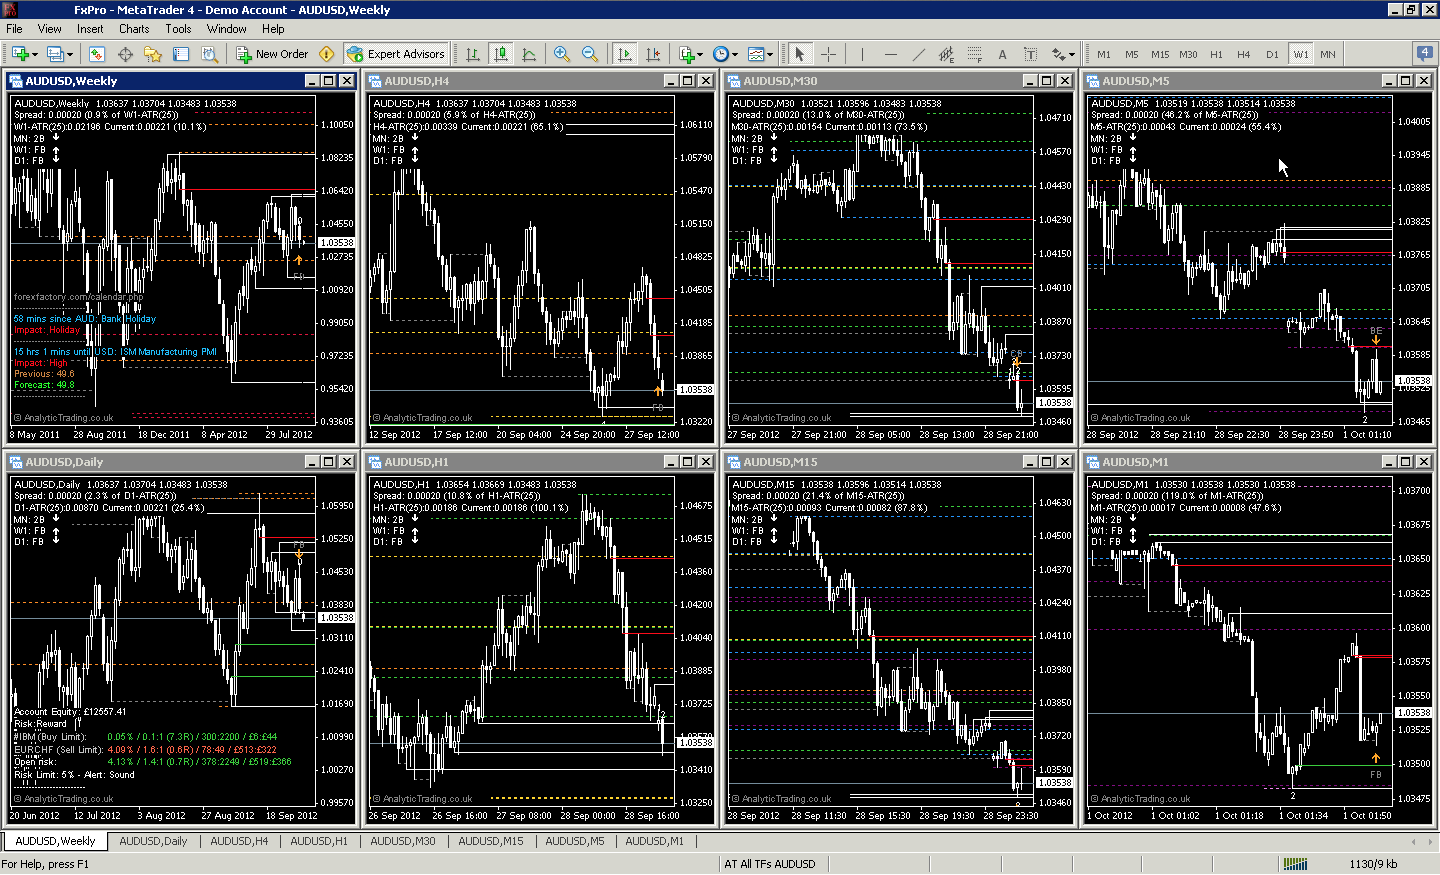
These profile setups show a multi-timeframe view for each of the major currency pairs, commodities and the S&P500. The timeframes we follow are weekly (W1), daily (D1), 4-hourly (H4), hourly (H1), 30-minute (M30), 15-minute (M15), 5-minute (M5) and 1-minute (M1).
We still monitor monthly bias but tend to find that monthly bias movements will match those on the weekly charts, which are more responsive to weekly news releases and sentiment shifts.
They are ordered from top to bottom, left to right, according to the tab order along the bottom, and you can quickly re-set their alignment to fill the screen using the menu option Window > Tile Vertically – this is something you will most likely need to do for all profiles, after your first installation and upgrades, to match your monitor resolution.
What is it for?
This gives us the ability to look at the price-action detail “inside” each candle from the higher timeframes, and look at lower timeframe price-action as it interacts with various timeframe levels from the Support & Resistance indicator.
How do we use it?
Our trading strategy is to look for higher timeframe price-action biases to look for trade direction, and the lower timeframes for levels to enter, exit and manage trades. It helps to look at each individual instrument on multiple time-frames – because ultimately trading levels and price-action is timeframe independent, a high or low on the monthly chart is a high or low on all timeframes below.
It takes some discipline to learn not to try to micro-manage trades from lower-timeframe – and hence less significant price-action. However it is also very useful to see, as early as possible, how price interacts with a big level to gauge whether it will be respected or broken.
There is no substitute for chart-watching time to learn how this works, but you will also notice how the market price movements are “fractal” and look very similar on all timeframes. It is just that the time-expectancy for trades that will vary according to the timeframe you prefer to trade – which you should understand more from the information the ATR, Candles and Spread indicators gives you.


 Includes all Profiles, Templates and Indicators, with statistics, screen, email and smartphone alerts.
