Installing indicators: A few minutes each if you know what you want.
Setting up your indicators: It is worth spending time experimenting, getting to know the settings of each indicator, and how they affect the information you see on your charts that you will be basing your trading decisions on.
MetaTrader Indicators
For us, the main aim of indicators is to show us points of interest on our charts – where we look to evaluate the latest winner between bulls and bears. We aim to only have the information shown on our charts that we need to make informed trading decisions, and to have those indications overlaid on that price bars/candles they relate to.
We tend not to use price-averaging indicators either on the chart, or in the histogram panel below because of its distance from current price-action. Yes, there is a certain amount of self-fulfilling prophecy and summary guidance provided by moving averages and other indicators but, for us, the edge they provide is too imprecise for our trading style and does not add anything to the chart that isn’t already apparent from the bar formations.
The indicators in this section are the ones we use daily, as our market dashboard, to look for trade set-ups and to manage trades. They are designed to work on all timeframes and markets, showing technical-trading information that we combine with our own judgement of the overall market, and how it is behaving in relation to similar correlated instruments.
- Average True Range (ATR) – This shows us the higher and current-timeframe Average Trading Range so that we can see when the current price may be coming close to exhaustion of that range. It is shown as a percentage of the range, so when price has moved over 100% then it has moved beyond the average movement and could be due a natural retracement.
- Breakout Levels – These are horizontal lines drawn at recent previous highs or lows, where they have large bullish or bearish candles passing through them without resistance. These are areas of interest when price comes back to re-test them from the opposite side.
- Candles – This indicator shows us the latest winner between bulls and bears in the battle to push price up or down, based on the close of each new candle in relation to the highs and lows of the previous 1, 2 or 3 candles. Essentially they show the condensed and collective result of all the price-action within them, and the confirmation or rejection of attempts for price to move in each direction.
- Gaps – Gaps are no different to large bullish or bearish candles, passing over a previous high or low. Again, we mark these areas of interest that price may come back to retest before continuing a bigger move or reversing it.
- News Alerts – Technical trading means we focus the majority of our analysis on the signals given in the aftermath of releases, but news releases always have the potential to reverse the current trend and increase volatility so you do need to be aware of these times and depending on your timeframe, be available to manage your trades if a new direction is established.
- Risk Manager – Designed to help you trade within your target risk profile and automatically calculate your risk percentage, risk:reward, R and stop:target values, alerting you if your open orders exceed your risk set tolerances.
- Spread in Pips or Points – This shows us in text on the chart the current spread of the instrument in pips, points or price, and as a percentage of the Daily ATR as a reference to the relative cost of trading that instrument compared to its potential movements. It gives us a much better idea of our trading costs relative to potential profit targets on our chosen timeframe.
- Support & Resistance Levels – These are simply lines drawn at the significant high and low points of price movement on each timeframe. The higher the timeframe, the stronger these levels can potentially be, so we tend to use higher timeframe levels to form our longer-term speculation where price may trade to before the next reversal or swing level. This indicators is designed to show the various levels of granularity of these levels on each timeframe, so that you can zoom in and our of price charts, and see how price reacts to them at each timeframe relevant to your trading or investment strategies. We thing you will find this one very eye opening!
- Swing Levels – This shows the latest swing levels that have as-yet not been retested from either side by current price-action and could be areas of interest to enter or exit trades depending on how price responds to them. More aggressive traders may enter and exit trades virtually at these levels and then manage their trades based on whether the bar formation reaction/close confirms or denies their speculation. More conservative traders may wait and see how a bar or candles closes when it touches that level before deciding on their trade direction bias.
Please do take the time to look at how all these indicators are designed to work, and consider how you might use this information to make your trading decisions…
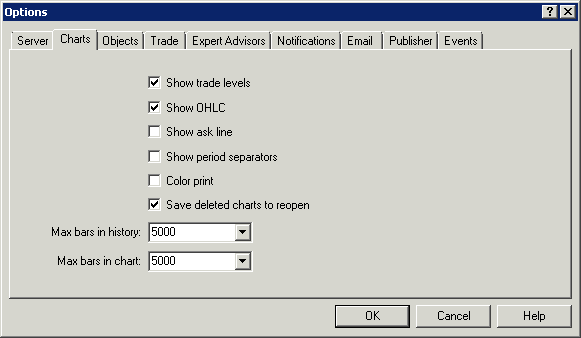
We recommend the following settings for your MetaTrader Tools > Options > Charts settings to help keep your charts fast to load, and from using to much disk space.
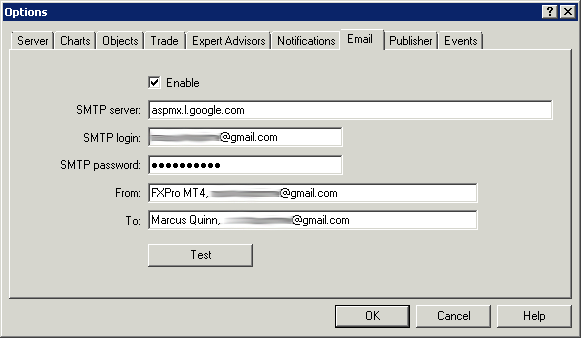
In order to receive email messages from our MetaTrader Indicators and EAs you’ll need to enter some settings into Tools > Options > Email.
We use Gmail, and find that very reliable, but because the default SMTP server smtp.gmail.com for Gmail doesn’t accept non-secure / non-SSL messages, you will need to use the lesser-known non-secure sendmail server address that they allow printers and other devices to send messages through: aspmx.l.google.com.
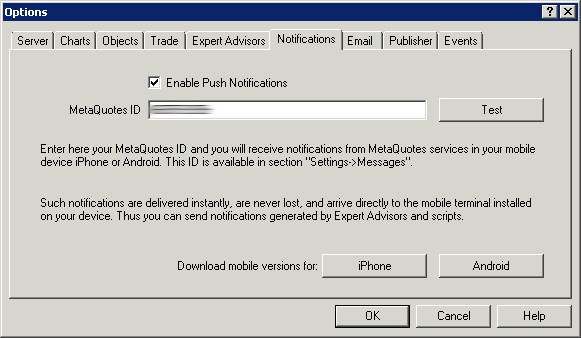
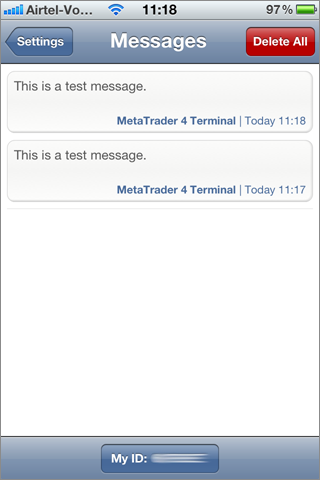
If you have an iPhone or Android smartphone, and have installed the excellent MetaTrader app, then you can also configure Push notifications to be sent directly to your phone to make sure you never miss an important message or signal.
You can find your phone’s ID the App under Settings > Messages and enter it in MetaTrader under Tools > Options > Notifications.


 Includes all Profiles, Templates and Indicators, with statistics, screen, email and smartphone alerts.
