Average True Range (ATR)
Time reading this page: 5 minutes
Time installing the indicator: Just a few minutes with our MetaTrader Pro setup
What does it do?
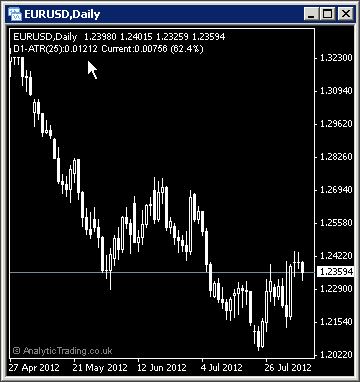
The Analytic Trading ATR indicator simply adds a small line of text to the top left corner of your charts to show the current timeframe average true range of the last 25 bars, and the total range of the current open bar in price, pips or points.

What is it for?
Knowing the average range of recent bars gives a numerical value for the average market price range per bar – this is the market’s recent volatility. Then we can see the likely range of currently open bar and how far price has moved compared to this average range in price, pips or points (and in brackets as a percentage) and therefore, what is a reasonable expectation for further movements on that current timeframe.
How do we use it?
We are looking for entry and exit prices that are of the highest value to us for our trade direction. This is where the market may be over-extended, in retracement from our latest candle bias, and/or close to a strong support or resistance level.
The ultimate target is to open and close trades when the price of the current open bar on the timeframe we are trading is at over 100% of its ATR. This gives us the maximum chance of trading at an exhaustion price, and a lower chance that the movement will continue to move against our current trade direction bias.
Average True Range (ATR) specific settings
In most cases these settings can be left on the default values, although users with different strategies, or preferences to our own, may want to be able to adjust them.
| Variable |
Default Value |
Possible Values |
Description |
| ShowDistance |
true |
true/false |
Shows the additional text for the size of the currently forming candle in price, pips or points and as a percentage of the ATR. |
| ChartATRPer |
25 |
whole numbers |
The number/period of bars used to calculate the ATR, generally a value of 25 will cover the average timespan of two timeframes higher and 5 would be a good average to cover one timeframe higher. |
| DisplayType |
native |
native/pips/points |
This is the decimal point display of price. For example on EURUSD on a 5 decimal place broker; native=0.00100, pips=10, points=100. |
Pip Calculation Settings
Pip calculation settings used on all indicators
In most cases these can be left on the default settings but may be used where you would like price shown in pips accurately on a broker where we have not yet tested the calculation for their setup.
| Variable |
Default Value |
Possible Values |
Description |
| TradeDPCalcType |
auto |
auto/semi-auto/manual |
For most brokers the indicator can automatically calculate the value of a pip using “auto”. However, if pips are incorrectly displayed for a broker or instrument you can try “semi-auto” and set the instrument type for the current chart, or you can set to “manual” and specify in a number to how may decimal points the value of a pip is. |
| TradeDP |
4 |
whole numbers |
If you need to use TradeDPCalcType=manual then here you need to specify the number of decimal places that 1 pip is at. So for a EURUSD price displayed as 0.12345 or 0.1234 the value would be 4, for USDJPY prices displayed as 00.123 or 00.12 the value would be 2. |
| ShowExtraInfo |
false |
true/false |
Setting this value to true will show the pip calculation mode in brackets at the end of the displayed text on the chart to help with diagnosing pip calculation. |
Display Settings
Display settings used on all indicators
In most cases these can be left on the default settings for a nice clean chart setup. You may wish to change some of these settings if you have your own preferred chart colours and layout etc.
| Variable |
Default Value |
Possible Values |
Description |
| display_font_colour |
white |
any colour name or RGB value |
The colour of the text comments information displayed on the chart. |
| display_font_size |
7 |
any whole number |
Values 6 to 12 are probably most appropriate. The default of 7 is designed to match the default instrument text information displayed in the top left corner of all MetaTrader charts. |
| display_corner |
0 |
0/1/2/3 |
0=TopLeft, 1=TopRight, 2=BottomLeft, 3=BottomRight. |
| display_distance_x |
3 |
any whole number |
The horizontal distance in pixels to display the comment text from the selected corner. |
| display_distance_y |
25 |
any whole number |
The vertical distance in pixels to display the comment text from the selected corner. |
| bgBoxColour |
Black |
any colour name or RGB value |
The colour of the background block used to make the comment text more readable over the price bars/candles/lines behind them. |
| bgBox_width_perc |
32 |
whole numbers from 20-100 |
This is the multiplier used to approximate the text width for the background coloured block to match it and keep the text readable but not cover up too much of the price bars/candles/lines behind it. |
| Original content here is published under these license terms: |
X |
|
| License Type: |
Read Only |
|
|
| License Abstract: |
You can read our original content in the context published at analytictrading.co.uk. We do not otherwise permit any copying or use without written agreement from Analytic Trading. You may, of course post links, and direct people to view the content directly at analytictrading.co.uk. |


 Includes all Profiles, Templates and Indicators, with statistics, screen, email and smartphone alerts.
