Time installing the indicator: Just a few minutes with our MetaTrader Pro setup
What does it do?
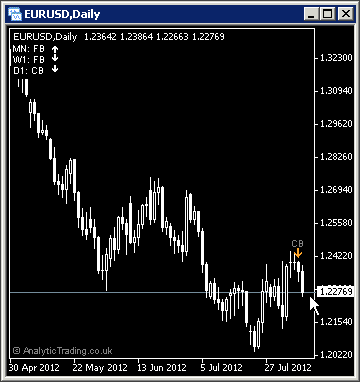
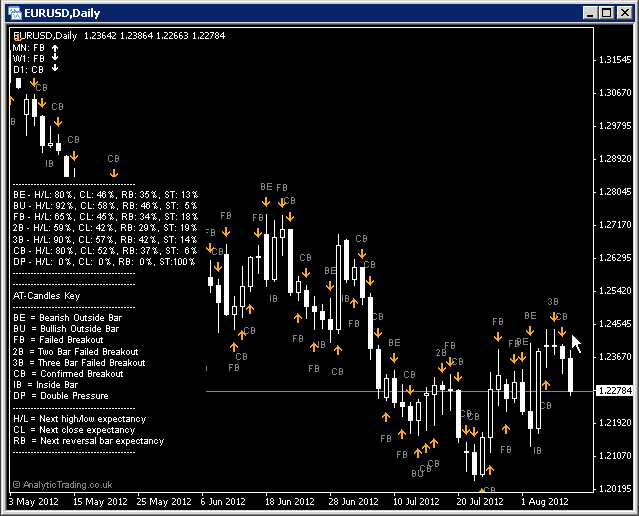
The Analytic Trading Candles indicator shows candle/bar patterns on the current timeframe as an arrow and label above/below the latest candle. Plus, as additional comment information, in the top-left of the screen to show the latest closed candle/bar candle pattern and potential bias from higher timeframes – helping us trade with stronger trends.
Finally, it can be set to give you screen and/or email alerts on the close of each bar on the current timeframe to save you watching charts and to remind you when there is new information to evaluate for your selected trading period.
The indicator also has the ability to show historical candle patterns and statistics on the movement of price following each candle/bar pattern for back-testing analysis.
The candle/bar patterns that we look for are named and abbreviated as follows:
BE = Bearish Outside Bar: A higher high, and a lower close than the previous bar.
BU = Bullish Outside Bar: A lower low and a higher close.
FB = Failed Breakout: A higher high or a lower low but a close within the previous bar.
2B = Two Bar Failed Breakout: A higher high or a lower low but a close within the previous two bars.
3B = Three Bar Failed Breakout: A higher high or a lower low but a close within the previous three bars.
CB = Confirmed Breakout: A higher close or a lower close than the previous bar high or low.
IB = Inside Bar: A lower high and a higher low than the previous bars.
OB = Outside Bar: A higher high and a lower low and a close within than the previous bar.
DP = Double Pressure: A high or low of exactly the same price
The statistics show the percentage of the time that each candle pattern is followed by profitable price movements:
H/L = Next high/low expectancy: The percentage of the time the bar following the bias candle reaches the latest high/low in the direction of the bias expectancy.
CL = Next close expectancy: The percentage of the time the candle following the bias candle closes above/below the latest high/low in the direction of the bias expectancy.
RB = Next reversal bar expectancy: The percentage of the time that the close of the next candle with a bias in the opposite direction in profit.
ST = Stop level expectancy: The percentage of the time the bar following the bias candle reaches the high/low (plus any StopMultiplier set) against the direction of the bias expectancy.
What is it for?
The bias statistics help us formulate our strategy to take advantage of the highest possible probabilities using the lead-edge price-action information from the last formed candle.
However, we include the “Next reversal bar expectancy” statistics to show that it isn’t as simple as just just opening and closing trades on each candle close and arrow print!
The bias from higher timeframes shows us the latest trend direction based on the latest testing of highs and lows, as a complete unit of that period, showing the winner between bulls and bears over that unit of time and is typically only valid during the formation of the following bar.
Of course, you should learn to recognise these patterns in your technical analysis but it is very helpful to have the information all included on one chart for evaluating evolving price-action on multiple timeframes at-a-glance.
How do we use it?
We use candle bias from higher timeframes to help us select the direction we are looking to trade. This gives us a simple and quick way of back-testing the expectancy of these patterns on any instrument we load the indicator onto. (Much quicker, easier and more immediate than using EAs and the Strategy Tester eh!)
Then we zoom into the lower timeframes to look at the significant support & resistance levels to trade, with the knowledge of the probability that the higher timeframe candle highs & lows have been reached in the past.
We are looking for new price-movements to significant levels that provide us with the best risk to reward ratio value – maximising our probability edge on the entry and exit of each trade.
Of course, new information is always being incorporated into the price of each market so we can then use the evolving price-action, using these candle formations, to manage our trades if we see the formation of bias against our initial trade direction.
This trade management is a further way that we can maximise our probability-edge throughout a trade, as we move into and out of various assets with a sensible proportion of our trading funds.
Candles indicator specific settings
In most cases these settings can be left on the default values, although users with different strategies or preferences to our own may want to be able to adjust them.
| Variable | Default Value | Possible Values | Description |
| BarsBack | 1000 | whole numbers | This is the numbers of bars back used to calculate the statistics and to display historical candle arrows and labels. Increasing the value will increase the memory requirements of the indicator load-time when using these features. Lower values will be more representative of recent market conditions but less statistically significant. |
| Show_Alert | false | true/false | The switch to turn screen on and off alerts for new candle patterns on the close of each bar. |
| Show_Key | false | true/false | The switch to turn on and off the candle patterns Key information on the chart. |
| Show_Statistics | false | true/false | The switch to turn on and off the candle pattern Statistics information on the chart. |
| Show_Stops | false | true/false | The switch to turn on and off the stop level spots from the chart, positioned based on the Stop_Multiplier value below. |
| Show_Past_Candles | false | true/false | The switch to turn on and off the display of past candle labels and arrows. |
| ShowMultiTFBias | true | true/false | The switch to turn on and off the display of multi-timeframe last-closed candle bias as chart comments information, in the top-left by default. |
| MinStatsTF | D1 | 0, M1, M5, M15, M30, H1, H4, D1, W1, MN | This is the lowest timeframe that the multi-timeframe bias chart comments information is shown for. We recommend you set this value to your preferred timeframe to help with your trading discipline and not get too distracted by lower timeframes when they are not relevant to your trade analysis. You should then find it easier to change chart timeframes and look at lower timeframe bias in relation to significant levels. |
| MTFupArrowCode | 233 | whole numbers | This number is the character from the Wingdings font set used to display the up arrow, it is highly unlikely you will want to change this. |
| MTFdownArrowCode | 234 | whole numbers | This number is the character from the Wingdings font set used to display the down arrow, it is highly unlikely you will want to change this. |
| MTFneArrowCode | 232 | whole numbers | This number is the character from the Wingdings font set used to display the neutral/sideways arrow, it is highly unlikely you will want to change this. |
| Stop_Colour | Red | Colour words or RDB values | The colour used for the Stops spot on the charts above/below each bar. |
| Stop_Multiplier | 0.0 | decimal numbers | 0.0 will position and calculate statistics based on a stop at the opposite high/low of each bar to the bias direction. 0.5 would position the stop at 50% of the bar high/low in the opposite direction to bias. 1.5 at 150%, 2.0 at 200% of the bar size and so on. You can also use this value to evaluate the statistics for retracement of price on subsequent bars before other statistics levels are hit. |
| Arrow_Colour | Orange | Colour words or RDB values | The colour of the arrows shown above/below bars. |
| Chart_Text_Colour | Gray | Colour words or RDB values | The colour of the abbreviated candle pattern labels shown above/below bars. |
| Chart_Text_Font | Arial | font names | The font use for the chart labels (the comment labels font can be set independently below). |
| Chart_Text_Size | 7 | whole numbers | The size of the font used for the chart labels (the comment labels font can be set independently below). |


 Includes all Profiles, Templates and Indicators, with statistics, screen, email and smartphone alerts.
