Swing Levels
Time reading this page: 5 minutes
Time installing the indicator: Just a few minutes with our MetaTrader Pro setup
What does it do?
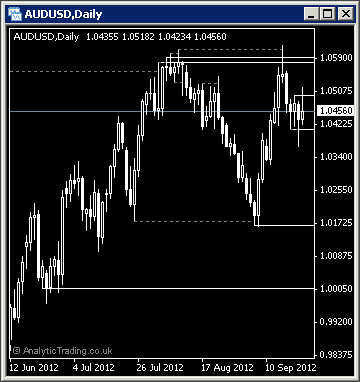
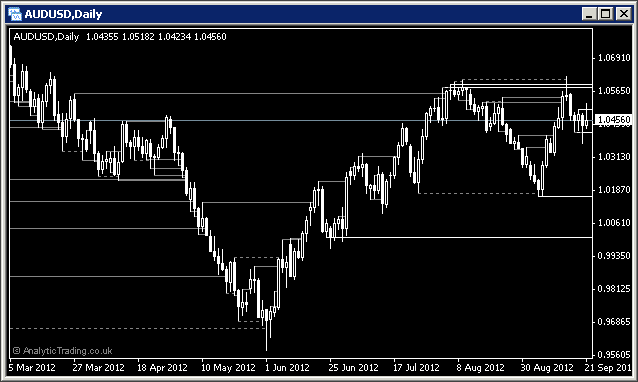
The Analytic Trading Swing Levels indicator simply shows where price highs and lows are first tested and rejected. It joins the previous high/low with a grey dotted line and then extends a white line from the top of the re-test bar.


What is it for?
The idea it to highlight the extremes of price movements and try to find the best risk to reward ratio trade setups at potential swing reversal points.
How do we use it?
We use the white lines to look for entry and exit levels. However, we use these levels slightly differently that the red and green lines produced by the Breakouts indicator – we look for a closed bar on either side of them for confirmation or rejection that the new high/low level will be breached in the short-term.
The more higher timeframes that the swing level occurs on the more interesting the level will be to is in making our trading entry and exit decisions.
Credit goes to Trader Dante for first introducing them to us and their significance, and we recommend attending Tom’s trading room to further understand how to use them in your trading.
From experience, we do not trade these signals independently but in combination with significant Support & Resistance Levels and Breakout levels.
Do have a look at how they work historically on various instruments before including them in your trading strategy.
Swing Levels specific settings
In most cases these settings can be left on the default values, although users with different strategies or preferences to our own may want to be able to adjust them.
| Variable |
Default Value |
Possible Values |
Description |
| BackBars |
1000 |
integer |
You can use any integer but please note that values over 1000 will slow down the loading of your charts so only do this for backtesting analysis. |
| LevelColor |
White |
any colour name or RGB value |
The colour of the solid line used to show the new high/low levels. |
| MaxLines |
3 |
integer |
The number of lines to show above and below the current price for everyday use when the historic levels are not set to show. |
| ShowHistory |
false |
true/false |
The switch to show all historical levels for backtesting the indicator performance on various timeframes. |
| ShowPreviousHighLow |
true |
true/false |
The switch to show the historical swing levels tested and rejected. |
Pip Calculation Settings
Pip calculation settings used on all indicators
In most cases these can be left on the default settings but may be used where you would like price shown in pips accurately on a broker where we have not yet tested the calculation for their setup.
| Variable |
Default Value |
Possible Values |
Description |
| TradeDPCalcType |
auto |
auto/semi-auto/manual |
For most brokers the indicator can automatically calculate the value of a pip using “auto”. However, if pips are incorrectly displayed for a broker or instrument you can try “semi-auto” and set the instrument type for the current chart, or you can set to “manual” and specify in a number to how may decimal points the value of a pip is. |
| TradeDP |
4 |
whole numbers |
If you need to use TradeDPCalcType=manual then here you need to specify the number of decimal places that 1 pip is at. So for a EURUSD price displayed as 0.12345 or 0.1234 the value would be 4, for USDJPY prices displayed as 00.123 or 00.12 the value would be 2. |
| ShowExtraInfo |
false |
true/false |
Setting this value to true will show the pip calculation mode in brackets at the end of the displayed text on the chart to help with diagnosing pip calculation. |
Display Settings
Display settings used on all indicators
In most cases these can be left on the default settings for a nice clean chart setup. You may wish to change some of these settings if you have your own preferred chart colours and layout etc.
| Variable |
Default Value |
Possible Values |
Description |
| display_font_colour |
white |
any colour name or RGB value |
The colour of the text comments information displayed on the chart. |
| display_font_size |
7 |
any whole number |
Values 6 to 12 are probably most appropriate. The default of 7 is designed to match the default instrument text information displayed in the top left corner of all MetaTrader charts. |
| display_corner |
0 |
0/1/2/3 |
0=TopLeft, 1=TopRight, 2=BottomLeft, 3=BottomRight. |
| display_distance_x |
3 |
any whole number |
The horizontal distance in pixels to display the comment text from the selected corner. |
| display_distance_y |
25 |
any whole number |
The vertical distance in pixels to display the comment text from the selected corner. |
| bgBoxColour |
Black |
any colour name or RGB value |
The colour of the background block used to make the comment text more readable over the price bars/candles/lines behind them. |
| bgBox_width_perc |
32 |
whole numbers from 20-100 |
This is the multiplier used to approximate the text width for the background coloured block to match it and keep the text readable but not cover up too much of the price bars/candles/lines behind it. |
| Original content here is published under these license terms: |
X |
|
| License Type: |
Read Only |
|
|
| License Abstract: |
You can read our original content in the context published at analytictrading.co.uk. We do not otherwise permit any copying or use without written agreement from Analytic Trading. You may, of course post links, and direct people to view the content directly at analytictrading.co.uk. |


 Includes all Profiles, Templates and Indicators, with statistics, screen, email and smartphone alerts.
